

All email marketers are obsessed with metrics. They help us measure performance, identify trends and guide future decisions.
If you’ve ever looked at an email marketing report and wondered what all the numbers actually mean, this guide covers the basics.
Send volume
The number of recipients your email campaign is sent to.
Bounced
If your email cannot be delivered, it will bounce.
Your email platform will receive a message explaining why the email could not be delivered. Common reasons include a non-existent email address, a full inbox or a temporary server issue.
Delivered
The number of sent emails minus the number of bounces.
This tells you how many inboxes successfully received your email.
Opens
The number of recipients who opened your email.
This is becoming increasingly difficult to track accurately as many email providers now perform automatic checks on incoming emails, which can trigger open tracking even when the recipient has not actually opened the message.
Open rate
The percentage of delivered emails that were opened.
For example, if 1,000 emails are delivered and 400 recipients open the email, your open rate is 40%.
Clicks
The number of recipients who click at least one link within your email.
Click through rate (CTR)
The percentage of delivered emails that generate at least one click.
For example, if 1,000 emails are delivered and 50 recipients click through, your click through rate is 5%.
A quick note on click through rates.
Some providers report total clicks rather than the number of people who clicked.
If those 50 people each click three links, you would have 150 total clicks and could claim a click through rate of 15%.
Personally, I don’t find this particularly useful. It can be misleading, doesn’t change the outcome, and can even result in click through rates above 100%.
I prefer to measure how many people clicked, not how many times they clicked.
Click to open rate
The percentage of opens that go on to generate a click.
If you have 400 opens and 50 clicks, your click to open rate is 12.5%.
Conversions
The number of recipients who complete the action you wanted them to take.
This might be:
- Making a purchase
- Completing a booking
- Submitting an enquiry
- Registering for an event
Ultimately, this is usually the metric that matters most.
Revenue generated
If your email platform is connected to your website, it may also be able to attribute revenue directly back to an email campaign.
This allows you to see not only how many people converted, but how much revenue those conversions generated.
Conversion rate
The percentage of delivered emails that result in a conversion.
For example, if 1,000 emails are delivered and 10 recipients make a purchase, your conversion rate is 1%.
Unsubscribes
The number of people who choose to stop receiving your emails.
Every marketing email should contain an unsubscribe option.
Spam complaints
Many email providers now allow users to unsubscribe directly from within their inbox.
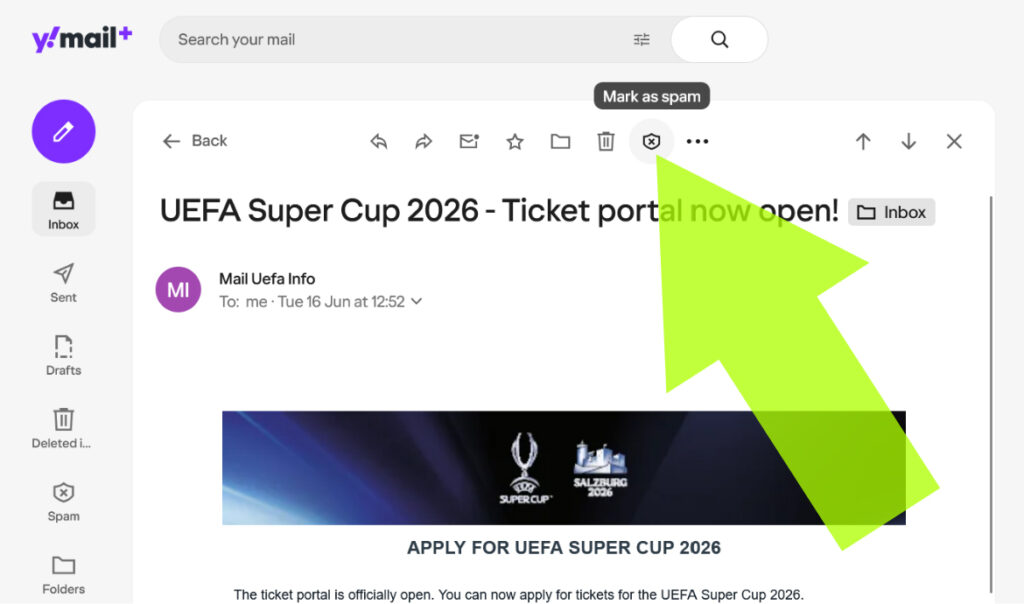
When this happens, a message is sent back to your email platform and the user is automatically removed from future sends.
So now you know what the numbers mean, how do you know whether your campaign performance is any good?
The honest answer is that there is no universal benchmark.
Performance varies enormously depending on the industry, the audience and the relationship you have with your subscribers.
Instead of comparing myself against an arbitrary industry average, I prefer to compare performance against previous campaigns.
If engagement falls, that’s interesting.
It suggests this particular content resonated less with my audience than previous emails.
I can then investigate why and test whether future campaigns perform better.
Ultimately, we want to optimise outcomes, not metrics.
Metrics are simply information that helps us make better decisions. They are not the goal in themselves.